
Please see the “How do I log into AlienVault?” procedure if you have not already to access your account.
1. The Dashboard is the central location in Alienvault that provides overall visibility into the activity that is occurring on your network.
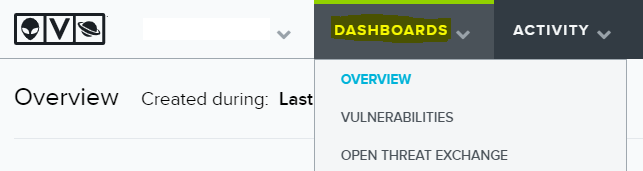
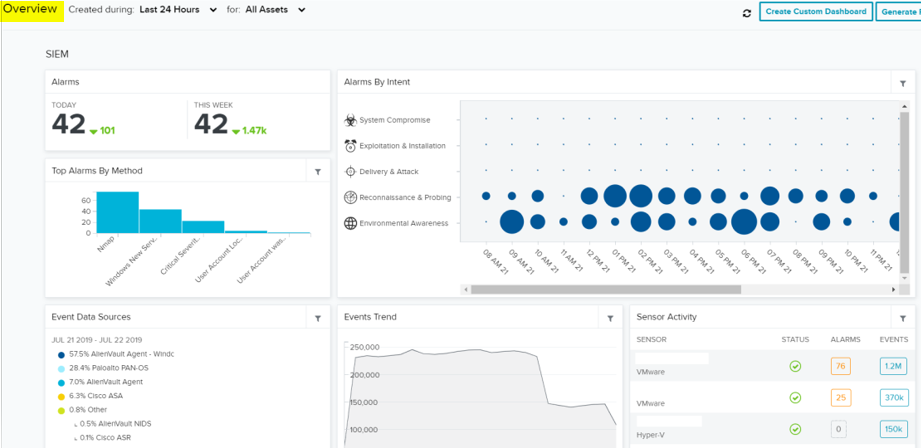
2. The main Overview page offers a bird’s eye view into such information as the number and types of alarms that have been occurring recently, the assets with the most alarms, the current status of your sensors, and more.
3. From the Overview page, you have the bility to change the time frame in which the data being displayed has occurred. By default, the time frame is set to 24 hours.
To change the time frame, click the drop-down next to “Created during: last 24 hours” to the right of “Overview” at the top-left of the page. From here, you can select from the pre-made time frames of the last 7 days, 30 days, or manually select a custom time frame range.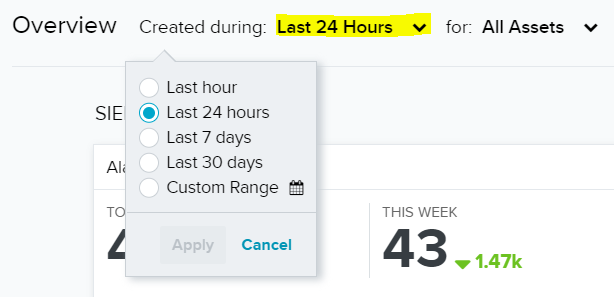
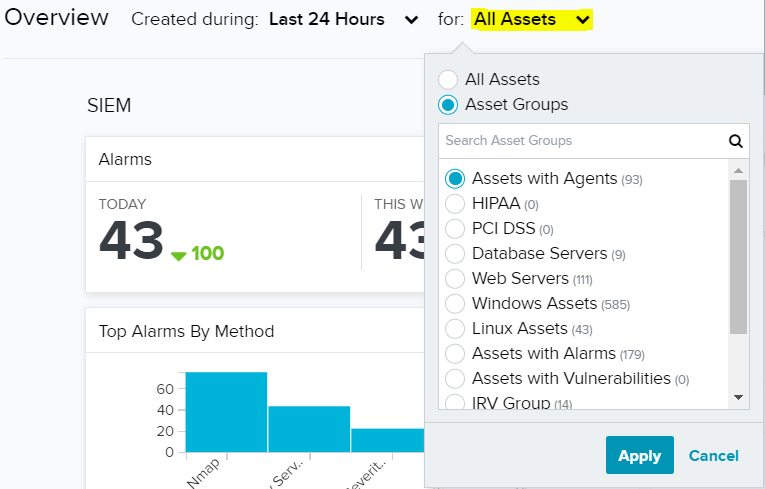
4. You may additionally change which assets the data is being pulled from on the Overview page. By default, all assets are selected, see the following to change which are selected.
a. Click the drop-down next to “for: All Assets”, to the right of Overview at the top-left of the page.
b. From here you can select either All Assets, or any of the available Asset Groups such as Assets with Agents, Windows Assets, Assets with Alarms, and others.
c. Hit the “Apply” button once you have finished your configurations.
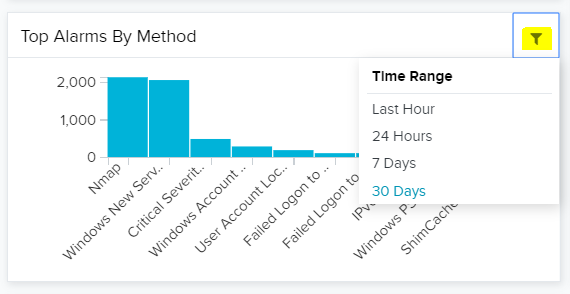
5. Not only can the time frame be changed for the entire Overview, but the time frame can be changed for each of the individual data reports and graphs, which are known as widgets. Each widget has a small “T” like icon in the top-right corner. Click on it opens a drop-down menu that offers various time frames to choose from.
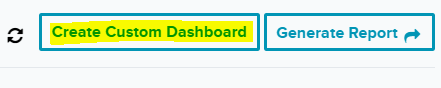
a. You can customize the number of widgets that occur in each column and row in your Dashobard by clicking “Create Custom Dashboard” at the top-right of the page.
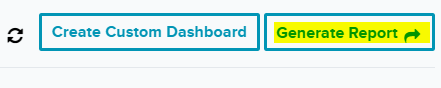
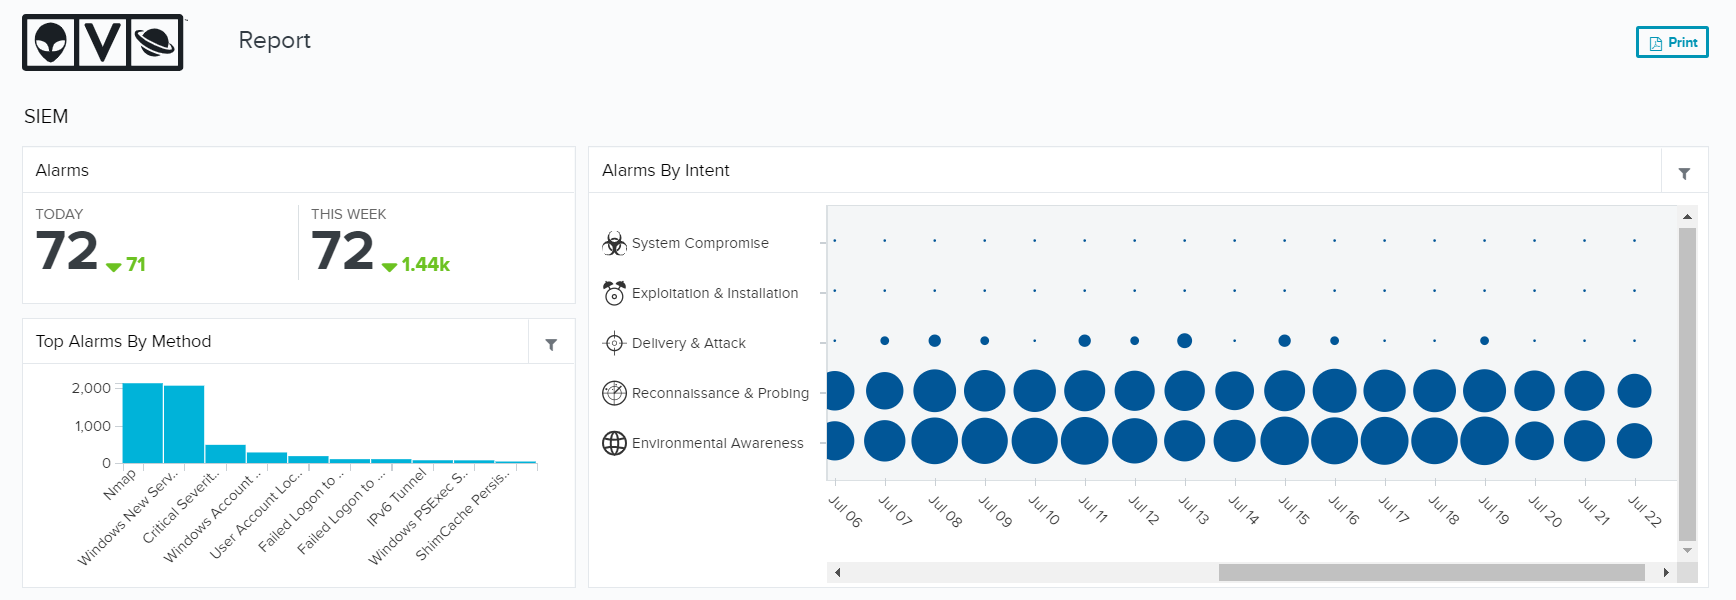
b. You can generate HTML reports of your current Dashboard. Click “Generate Report” at the top-right of the page.
c. Name the report, and then click Export. A new tab will open, showing you the current report, which can be printed.
If you experience any technical difficulties with your account please contact us at 844-462-4625 option 3 and ask to speak with our security department regarding your issue.